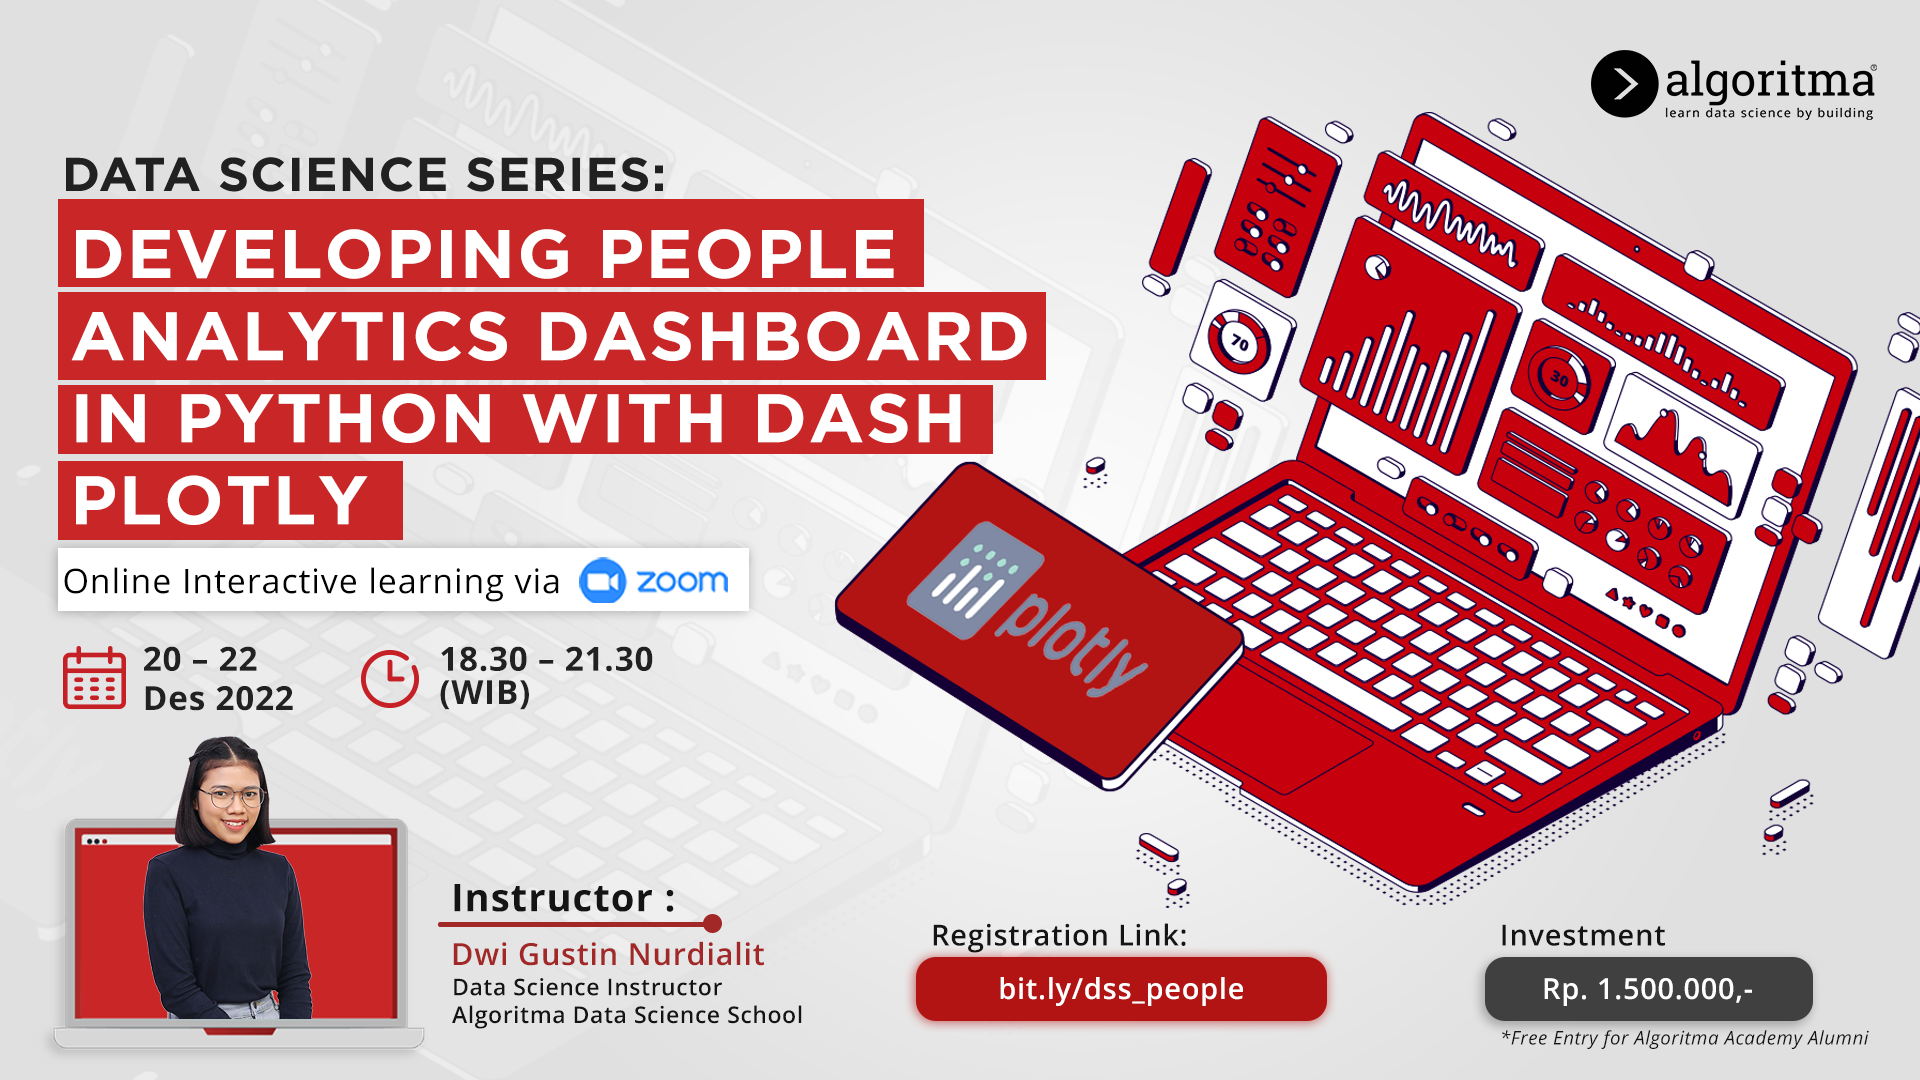
Developing People Analytics Dashboard in Python
Transform your hiring process with a Python-built Dashboard

Transform your hiring process with a Python-built Dashboard
In today’s data-driven world, making informed decisions about your workforce can be a daunting task. That’s why it’s crucial to have a strong understanding of statistics, programming, and domain knowledge in the people analytics process. With these skills, you can easily make hiring decisions and effectively manage your team’s performance.
But how do you effectively communicate all this data? Visualization is key, but data changes quickly and can be overwhelming. That’s where Dash comes in. Dash is a Python framework for building web applications that allows you to create interactive, customizable dashboards with ease. Plus, it’s open-source and runs on any web browser.
Join us for a 3-day online workshop where you’ll learn how to develop your own People Analytics Dashboard in Python with Dash and Plotly. Our experienced instructors and teaching assistants will provide you with hands-on examples and personalized support throughout the course. Don’t miss out on this opportunity to unlock the power of data and take your hiring process to the next level.
Upon completion of this workshop, you will be able to:
PREFACE
PYTHON PROGRAMMING BASICS
EXTRACTING INSIGHT & AND VISUALIZING THEM
BUILDING DASHBOARD
This testimonial video is taken after our previous Online Data Science Series: Time Series Analysis for Business Forecasting.
Our learning format is online-interactive, you will feel the interactive experience as if you were present in a physical classroom. You can access the class using your Zoom account on pre-defined dates.


Workshops in this series are tailored to casual programmers and non-programmers that are taking their first steps into data science. It assumes no prior knowledge or academic background, and attendees will be introduced to the beautiful art of writing R / Python code to produce data visualization and build machine learning models. The workshop has a gentle learning slope that is designed with non-technical professionals and academics in mind.
If I don’t have any IT or programming skills, can I still attend this workshop?
Yes, you can still attend the workshop as it is a beginner-friendly workshop.
How to join the interactive-online learning class after I’ve done the payment & registration?
Our system will send you an email containing a link and details to join a Google Classroom.
What platform will be utilized for this online-interactive learning workshop?
Online learning will be conducted via Zoom.us, Link to join the Zoom Class will be announced via Google Classroom.
How will the participants receive the learning materials?
Learning materials can be obtain via Google Classroom
Would I receive a certificate after participating in the Workshop?
Yes, you will receive a certificate of completion.

A Data Science Instructor at Algoritma Data Science School, experience building data-intensive applications, tackling complex architecture and scalability issues across multiple industries. Proficient in predictive modeling, data processing, data mining algorithms, and scripting languages, including Python and R. Capable of creating, developing, and deploying various adaptive services to translate business and functional qualifications into tangible deliverables. She has more than 150 hours of teaching experience and has been involved in numerous consultative data science training and course production for our clients, to name a few:
PT. Algoritma Data Indonesia.
RDTX Square, 9th Floor. Setiabudi, DKI Jakarta 12930.
Office: 0816-692-471
Email: community@algorit.ma