fbpx

Business Intelligence Course

Unlock the full potential of your data and make smarter business decisions.

  • Schedule

    3 – 13 June 2024

  • Time

    18.30 – 21.30 WIB

  • Venue

    Online via Zoom

Overview:

The Tableau for Business Intelligence course is a series of progressive courses designed to efficiently guide participants towards expertise in creating data-driven solutions and a comprehensive understanding of the fundamental components that underpin modern, industrial-grade Business Intelligence.

Our program is designed to be accessible to all, regardless of prior knowledge of Tableau, statistics, mathematics, or algebra. The curriculum is tailored to deliver a gradual learning experience, prioritizing hands-on instruction and individualized guidance from our dedicated team of instructors and teaching assistants.

As participants progress through the course, they will gain valuable experience in constructing, assessing, and implementing Business Intelligence products through a series of consecutive projects.

Course Syllabus

Our Business Intelligence Course is designed to provide learners with a solid foundation in essential BI skills, techniques, and tools, gradually building up students’ knowledge and proficiency in data analysis and visualization. Throughout the courses, students will engage in hands-on projects, case studies, and real-world scenarios that will help them develop practical skills and gain valuable experience. By completing all three levels, learners will be fully equipped with the knowledge and tools to handle complex data sets, generate insights, and make data-driven decisions.

This module introduces participants to the Tableau platform, covering essential application terminology and visual indicators for fields. By establishing a strong foundation, participants will be equipped to effectively navigate and utilize the Tableau environment throughout the course.

  • The Tableau Platform
  • Application Terminology
  • Visual Indicators for Fields

Explore the Tableau workflow and get started with creating effective visualizations in this module. Participants will learn about the various elements that make up a visualization and gain the knowledge necessary to create and manage compelling visualizations throughout the course.

  • Understanding the Tableau Workflow
  • Elements of a Visualization
  • Getting Started in Tableau

This module teaches participants how to set up connections and manage data sources in Tableau, including creating live data connections, saving and editing data sources, and modifying data attributes. By acquiring these skills, learners will be able to work with data effectively throughout the course.

  • Tableau File Types and Extensions
  • Creating a Live Data Connection
  • Saving and Editing a Data Source
  • Modifying Data Attributes
  • Understanding Changes to Data

This module focuses on effective data organization within Tableau, covering data filtering techniques, creating date filters, applying sorting methods, utilizing groups, and creating and using hierarchies. Participants will master these skills to optimize their visualizations and enhance their data analysis capabilities.

  • Data Filtering
  • Creating Date Filters
  • Sorting
  • Using Groups
  • Creating and Using Hierarchies

This module teaches participants techniques for viewing specific values in Tableau, such as creating crosstabs, managing grand totals and subtotals, altering aggregation, and developing highlight tables. By acquiring these skills, learners will be able to focus on key data points and create more targeted visualizations.

  • Creating Crosstabs
  • Grand Totals, Subtotals, and Changing Aggregation
  • Creating Highlight Tables

This module explores the application of data visualization for business analysis, including solving business problems using visualizations, understanding the principles of data visualization, extracting insights, and creating actionable recommendations. By acquiring these skills, participants will be empowered to leverage data visualization for strategic decision-making.

  • Solving Business Problems with Data Visualization
  • Understanding Data Visualization
  • Extracting Insights from Data Visualization
  • Creating Actionable Insights

This module focuses on demonstrating the relationships between numerical values in Tableau. Participants will learn to show correlations and outliers using scatter plots, create and analyze scatter plots, use the highlighter and analytics pane, and work with trend lines, trend models, reference lines, and bands. By mastering these skills, learners will enhance their ability to effectively visualize and analyze numerical relationships.

  • Showing Correlations and Outliers with Scatter Plots
  • Creating a Scatter Plot
  • Analyzing with the Highlighter
  • Analyzing Outliers Using Explain Data
  • Using the Analytics Pane
  • Trend Lines and Trend Models
  • Reference Lines and Bands

This module covers calculations within Tableau, including different calculation types, creating and editing calculated fields, and various examples of calculated fields. Participants will also explore calculations and aggregations, string functions, split and custom split operations, type conversions, and date calculations. By mastering these concepts, learners will be able to perform advanced data analysis in Tableau.

  • Calculation Types
  • Creating and Editing Calculated Fields
  • Formula Editor Conventions
  • Examples of Calculated Field Types
  • Calculations and Aggregations
  • String Functions
  • Split and Custom Split
  • Type Conversions
  • Date Calculation Examples

This module focuses on analyzing data using quick table calculations in Tableau. Participants will gain an overview of table calculations, learn how to apply quick table calculations, and use rank to display data from largest to smallest. By mastering these techniques, learners will be able to efficiently analyze data and draw meaningful conclusions.

  • Table Calculation Overview
  • Using Quick Table Calculations
  • Using Rank to Show Largest to Smallest

This module focuses on making visualizations available to others in Tableau. Participants will learn how to create dashboards, implement actions, and publish dashboards online. By mastering these skills, learners will be able to effectively share their insights and visualizations with colleagues and stakeholders.

  • Creating dashboards
  • Implementing actions
  • Publishing dashboards online

This module focuses on intermediate calculations in Tableau. Participants will explore where calculations occur, how to create and edit calculated fields, work with aggregations, aggregate dimensions in calculations, and understand join calculations and LOD expressions. By mastering these skills, learners will enhance their analytical capabilities in Tableau.

  • Understanding Where Calculations Occur
  • Creating and Editing Calculated Fields
  • Calculations and Aggregations
  • Aggregating Dimensions in Calculations
  • Level of Detail (LOD) Expressions

This module focuses on comparing measures in Tableau. Participants will learn techniques such as creating bar-in-bar charts, using bullet graphs, and working with reference lines and bands. These skills will help learners analyze and visualize measure comparisons effectively.

  • Comparing Two Measures (Bar-in-Bar Chart)
  • Comparing Progress Toward a Goal (Bullet Graph)
  • Using Reference Lines
  • Reference Bands

This module explores the analysis of data distributions in Tableau. Participants will learn how to use bins and histograms, create box and whisker plots, and understand basic distribution statistics. By mastering these skills, learners will be able to effectively visualize and analyze data distributions.

  • Bins and Histograms
  • Box and Whisker Plots
  • Basic Distribution Statistics

This module  introduces participants to geographic data visualization in Tableau. They will learn how to create maps and navigate and select elements within them. Acquiring these skills will allow learners to effectively represent and analyze geospatial data.

  • Introduction to Geographic Data Visualization in Tableau
  • Creating Maps in Tableau
  • Navigating and Selecting Elements in Maps
  • Working with Geospatial Data in Tableau

In this module, you will learn about advanced table calculations in Tableau. You will get an overview of table calculations, tips to master them, and understand how to control them at different levels. You will also explore how to handle missing data and apply table calculations for statistical analysis. This module will help you enhance your data analysis skills in Tableau.

  • Table Calculation Overview
  • Tips for Learning Table Calculations
  • Levels of Control
  • Table Calculation Scope and Direction
  • Table Calculation Specific Dimension
  • Other Scope and Direction Options
  • Null Values in Table Calculations
  • Table Calculations for Statistical Analysis

This module teaches participants how to create and use parameters in Tableau, including applying them with filters and incorporating them with reference lines, to create interactive and dynamic visualizations.

  • Using Parameters
  • Parameters and Filters
  • Using Parameters with Reference Lines

In this module, participants will learn how to define subsets of data in Tableau. They will explore different techniques for managing data subsets, such as using sets, combined sets, in and out sets, and nested sorting and context filters. They will also learn how to analyze outliers using Explain Data. By mastering these techniques, learners will be able to manage data subsets more effectively and create more targeted visualizations.

  • Using Sets
  • Combined Sets
  • In and Out Sets
  • Analyzing Outliers Using Explain Data
  • Nested Sorting and Context Filters

This module focuses on creating and optimizing dashboards in Tableau. Participants will learn how to plan and build dashboards, add interactivity with filters and actions, and follow visual best practices. They will also learn how to use tooltips effectively and publish their dashboards online for wider accessibility. By mastering these skills, learners will be able to create dynamic and engaging dashboards that effectively communicate data insights.

  • Planning and Designing Dashboards
  • Building Dashboards
  • Adding Interactivity with Filters
  • Adding Interactivity with Actions
  • Visual Best Practices for Dashboards
  • Utilizing Tooltips
  • Publishing Dashboards Online

Course Receivables

Receivables:

  • Cutting Edge Curriculum

    Our cutting-edge curriculum for the Business Intelligence Course is designed to provide students with the latest and most relevant knowledge and skills in the field. We regularly update our curriculum to stay up-to-date with the latest trends, tools, and techniques in business intelligence.

  • Project Oriented Learning

    Our Business Intelligence Course offers students the opportunity to work with real-life cases and learn under the guidance of our qualified instructors. Students will develop a personal portfolio with projects that showcase their newly acquired skills and knowledge, preparing them to make an impact in the industry.

  • Certification of Completion

    Upon completing the Business Intelligence Course, students will receive a certificate of completion as proof of their mastery of the course material.

  • Quality Learning Environment

    Our courses offer a quality learning environment, fostering a collaborative and supportive atmosphere for students to learn and grow their skills.

Learn business intelligence by building:

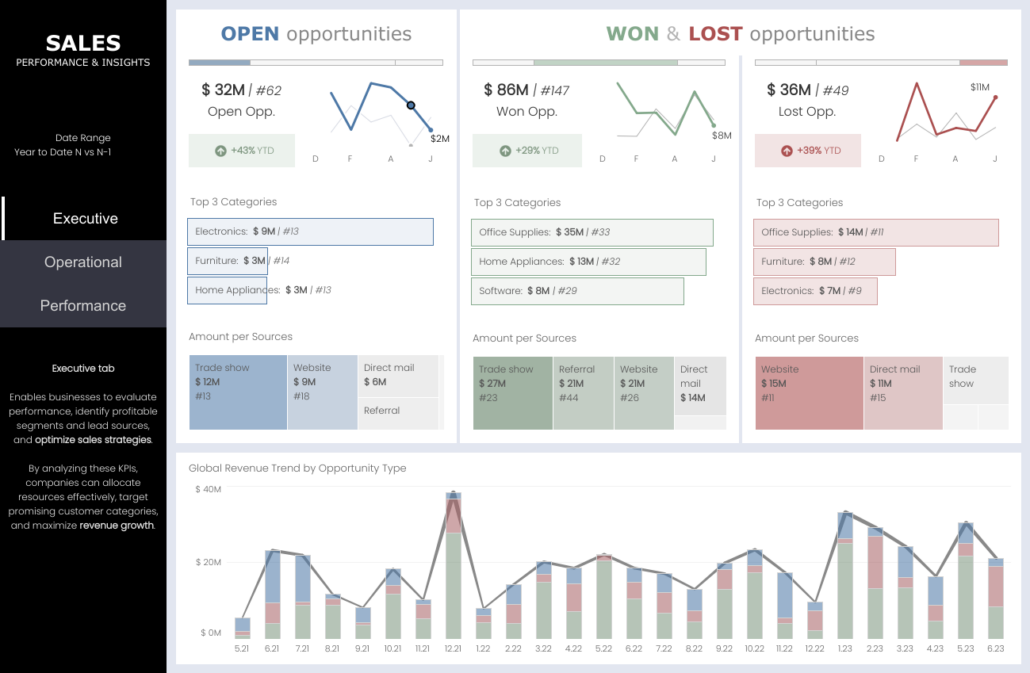
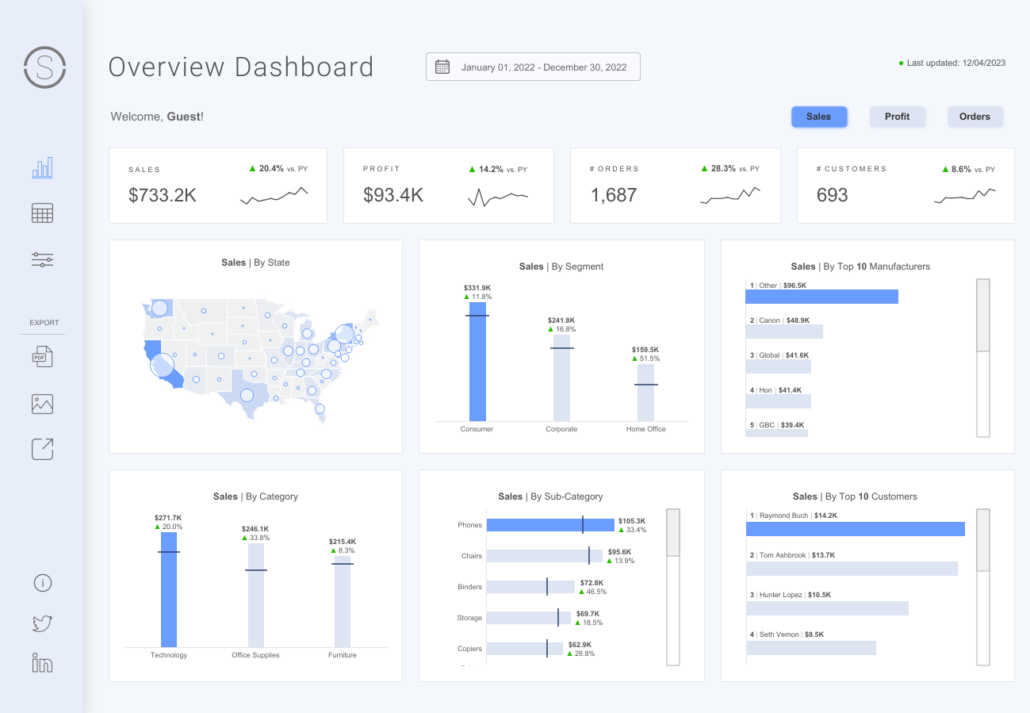
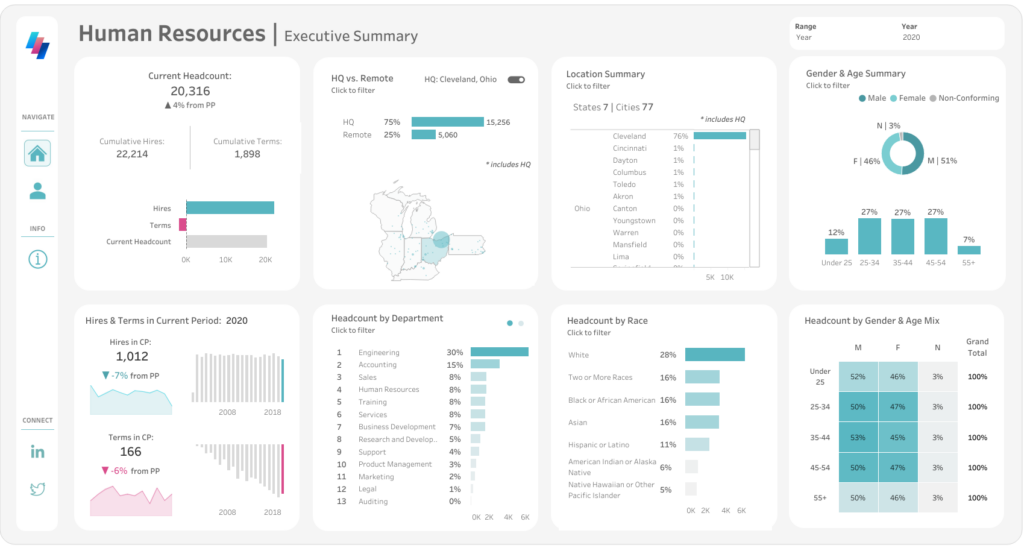
Our students get hands-on experience working with real-life examples using sample datasets generously provided by our team of mentors and corporate partners. We firmly believe in a learn-by-building approach, and our instructors are passionate about your growth and education, striving to provide an exceptional learning experience.

Frequently Asked Questions

Business Intelligence (BI) refers to the technologies, processes, and practices used to collect, analyze, and transform data into useful information that can be used to inform decision-making and improve business operations.

The Business Intelligence Course is suitable for anyone interested in gaining a deeper understanding of data analysis, data visualization, and reporting. It is particularly beneficial for business analysts, data analysts, data scientists, and other professionals involved in data-driven decision-making.

Our Business Intelligence Course has no prerequisites.

The course will be delivered onsite. Our training center is located in the heart of Jakarta at Menara Kadin, 4th Floor, Jl. H. Rasuna Said Kav x 2, Setiabudi, South Jakarta.

Yes, the Business Intelligence Course includes one capstone project. The project provide learners with an opportunity to apply the skills and knowledge they have acquired throughout the course to real-world scenarios and data sets.

Yes, learners who complete all three levels of the course and pass the final assessments will receive a certificate of completion from Algoritma.