fbpx

Data Science Fundamentals

Data Visualization and R Programming

3

Days

Course details :

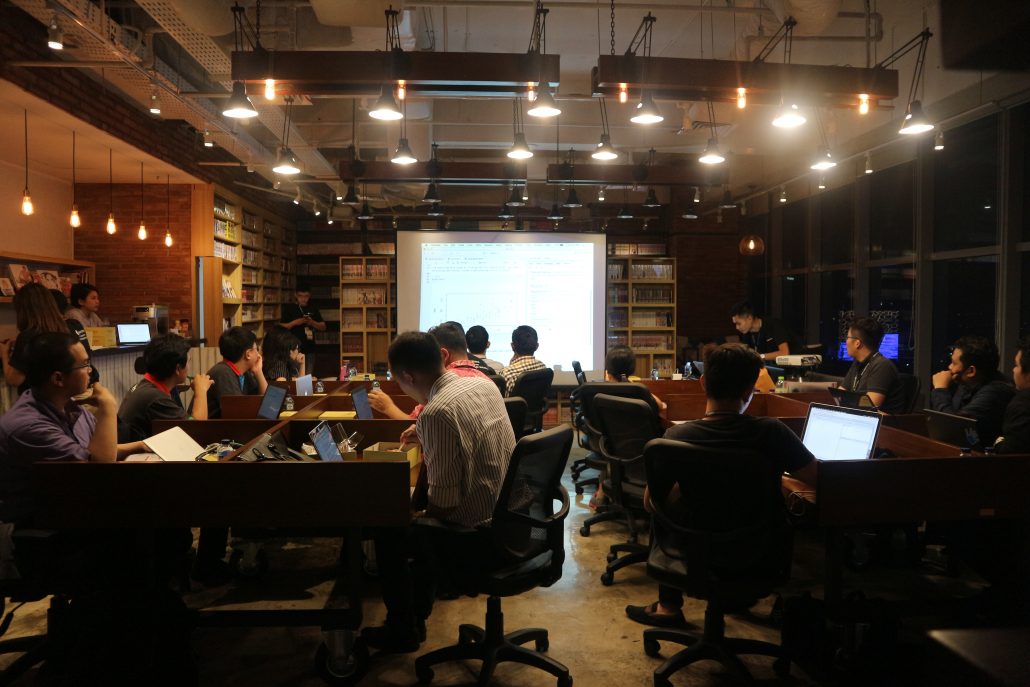
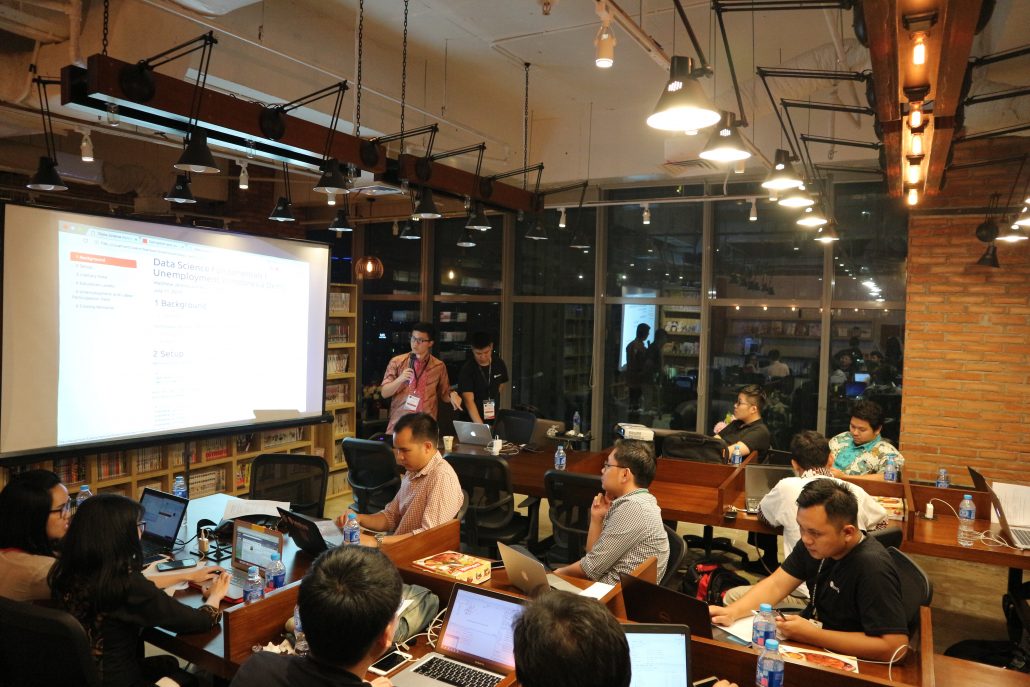
This 3-day workshop is designed to help you master various data visualization techniques, using a combination of R’s built-in plotting capabilities, the ggplot library, and Google Visualization API.

Student will learn the core skills to build visually appealing, rich graphical narratives through practical, hands-on exercise using real, commercial datasets. At the end of the workshop, student will present their project and demonstrate their thought process leading up to their visual products.

Learning from data is virtually universally useful. Master it and you’ll be welcomed nearly everywhere! ~ John Elder, Elder Research

Please bring along:

  • 1x Laptop
  • Purchased ticket (from organizer’s website)

MEDIA PARTNERS:

In a nutshell

  • Data Science Introduction

    Day 1

  • Statistics Fundamentals

    Day 1

  • Grammar of Graphics & ggplot

    Day 2

  • Data Visualization in Practice

    Day 3

Event Ended
Explore other data science workshops

Trainer

Samuel Chan

samuel@algorit.ma

Detailed Syllabus

Syllabus: Data Science Fundamentals (I)

Data Science Explained

  • Description of course materials and the learning environment
  • A comprehensive view on the roles of data science, the relating professions, career prospects and outlook.
  • Description of the workflow, tools, setup and programming languages in the course

R Programming Basics

  • Setting up the Workspace and Environment
  • Working with data types: scalar, vector, list, matrix, data frame
  • R’s built-in functions
  • Inspecting data using built-in functions
  • R’s plotting capabilities
  • R Markdown and reproducible research

Statistics Fundamental

  • Demonstrate the use of various statistics in exploratory data analysis: 5-number summary, mean, mode, interquartile range, variance, standard deviation and correlation
  • Plots: scatterplots, scatterplot matrices, line graphs, histogram, ab-line, x and y-axis styling, plot title, tips and tricks for plotting in R
  • Quick way to get a “sense” of the distribution of our dataset
  • Linear Regression, Confidence intervals and Hypothesis Testing

Plotting in R

  • Plotting options: base, lattice graphs, ggplot
  • Grammar of Graphics
  • Beautiful plots: scatterplots, line, histogram, violin plot, boxplot, jitter plot
  • Styling your plots: Title, Labels, Font Family, Axes
  • Styling legends and guides
  • Layering other aesthetics in ggplot
  • Multi-panel plots

Advanced styling

  • Working with built-in themes
  • Build your own theme
  • Using pre-made theme
  • Working with colors

Visual Narrative

  • Case in point: point vs jitter
  • Case in point: box plot vs violin plot
  • Combining plots to form a beautiful narrative
  • Tips for storytelling with data

Data Visualization in Practice

  • Combining a regression line with beautiful plotting aesthetics
  • Adding a confidence interval
  • Code solution to data visualization project exercise offered by Harvard University’s Institute for Quantitative Social Science (IQSS)’s workshop
  • Data sources for data visualization project

Other Libraries for Data Visualization

  • ggRepel for text labels
  • Latticeplot
  • Interactive plotting with manipulate()
  • Example Demo: Presenting a data visualization project with ggplot

This workshop will cost 3 workshop credits for subscribers. Non-subscribers are welcomed to participate at a cost of IDR3,000,000.

Workshop Receivables:

  • Workshop Lecturer’s Notes

    Including 2x Course Books (PDF), HTML files, course transcripts (if any).

  • Highly-accelerated Learning

    Learn under the assistance of mentorship of our lead instructor and a band of qualified teaching assistants throughout the 3 day course.

  • Certification of Completion

    Show current and prospective employers that you’ve completed the course with a signed certificate of completion.

  • Quality Learning Environment

    We pay meticulous attention to the logistical details of our workshops: quality audio and visual setups, comfortable sitting arrangements, small group size. Dinners are included for evening workshops.

  • Supplement Materials

    Receive supplement datasets to practice on, reference notes, working files (R Notebook or Jupyter Notebook), and other materials that will help you master the topics.

Data Science Fundamentals Series

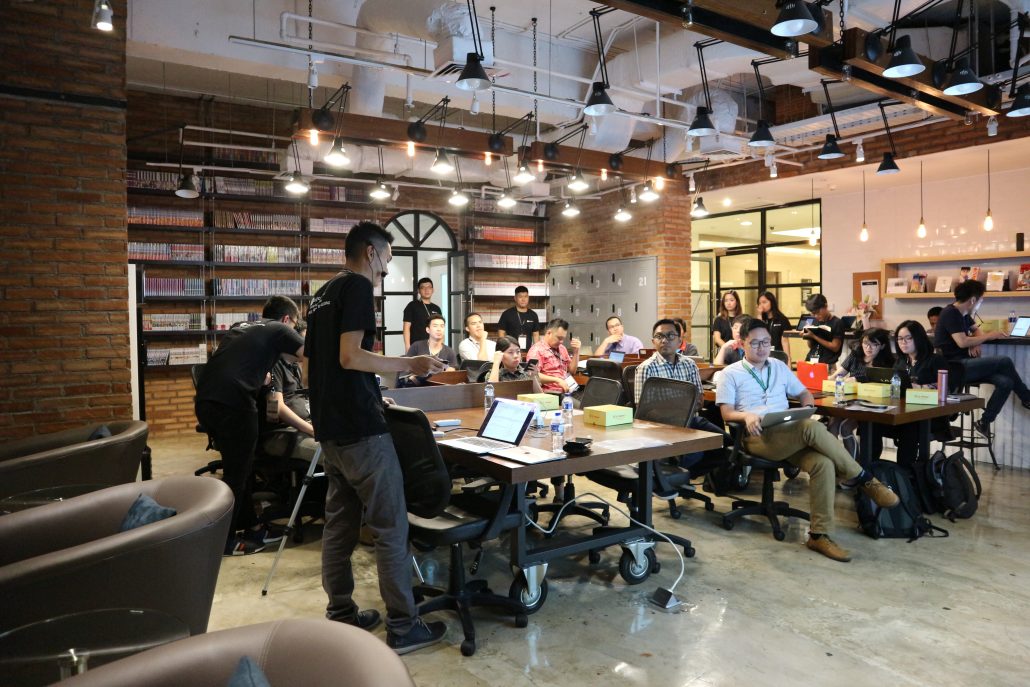
Workshops in our Data Science Fundamentals series are tailored to casual learners, working professionals and non-programmers that are taking their first steps into data science and machine learning.

Students are not assumed to have a working knowledge of R or prior proficiency in statistics / mathematics / algebra. At such the workshop follows a gentle learning curve and emphasize on hands-on, one-to-one tutoring from our team of instructors and teaching assistants.

Consider taking our Data Science Intermediate workshops instead for more advanced-level materials in statistical programming and machine learning.

Past Workshops in this Series:

Students work through tons of real-life examples using sample datasets donated by our team of mentors and corporate partners. We believe in a learn-by-building approach, and we employ instructors who are uncompromisingly passionate about your growth and education.